本文最后更新于:14 天前
图像直方图
通过灰度直方图看到图像的照明效果
](https://eveseven.oss-cn-shanghai.aliyuncs.com/20190115154350.png)
代码实例
#!/usr/bin/env python
# -*- coding: utf-8 -*-
# @Time    : 2019/3/9 21:28
# @Author  : Seven
# @File    : HistDemo.py
# @Software: PyCharm
# function : 图像直方图
import cv2
import matplotlib.pyplot as plt
import numpy as np


def GrayHist(img):
    """
    calcHist(images, channels, mask, histSize, ranges, hist=None, accumulate=None)
    images — 源矩阵指针(输入图像,可以多张)。 但都应当有同样的深度(depth), 比如CV_8U 或者 CV_32F ,
             和同样的大小。每张图片可以拥有任意数量的通道。
    channels — 通道的数量,每个通道都有编号,灰度图为一通道,即channel[1]=0;对应着一维。
                BGR三通道图像编号为channels[3]={0,1,2};分别对应着第一维,第二维,第三维。
    mask — 掩码图像:要对图像处理时,先看看这个像素对应的掩码位是否为屏蔽,如果为屏蔽,就是说该像素不处理(掩码值为0的像素都将被忽略)
    hist — 返回的直方图。
    histSize — 直方图每一维的条目个数的数组,灰度图一维有256个条目。
    ranges — 每一维的像素值的范围,传递数组,与维数相对应,灰度图一维像素值范围为0~255。
    :param name: 命名标志
    :param img: 图片数据
    :return:
    """
    img = cv2.cvtColor(img, cv2.COLOR_BGR2GRAY)
    hist = cv2.calcHist([img],
                            [0],
                            None,
                            [256],
                            [0.0, 255.0])

    plt.plot(hist)
    plt.xlim([0, 256])
    plt.show()


def colorHist(img):
    # 颜色直方图
    channels = cv2.split(img)

    colors = ('b', 'g', 'r')
    for (chan, color) in zip(channels, colors):
        hist = cv2.calcHist([chan], [0], None, [256], [0, 256])
        plt.plot(hist, color=color)
        plt.xlim([0, 256])
    plt.show()


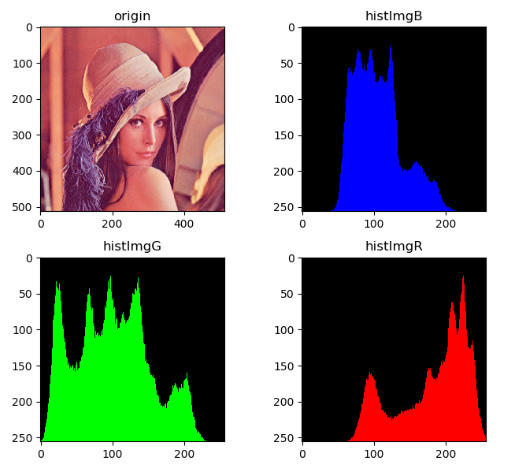
def channelsHist(img):
    b, g, r = cv2.split(img)

    def calcAndDrawHist(image, color):
        hist = cv2.calcHist([image], [0], None, [256], [0.0, 255.0])
        minVal, maxVal, minLoc, maxLoc = cv2.minMaxLoc(hist)
        histImg = np.zeros([256, 256, 3], np.uint8)
        hpt = int(0.9 * 256);

        for h in range(256):
            intensity = int(hist[h] * hpt / maxVal)
            cv2.line(histImg, (h, 256), (h, 256 - intensity), color)

        return histImg;

    histImgB = calcAndDrawHist(b, [255, 0, 0])
    histImgG = calcAndDrawHist(g, [0, 255, 0])
    histImgR = calcAndDrawHist(r, [0, 0, 255])

    plt.figure(figsize=(8, 6))
    plt.subplot(221)
    plt.imshow(img[:, :, ::-1]);
    plt.title('origin')
    plt.subplot(222)
    plt.imshow(histImgB[:, :, ::-1]);
    plt.title('histImgB')
    plt.subplot(223)
    plt.imshow(histImgG[:, :, ::-1]);
    plt.title('histImgG')
    plt.subplot(224)
    plt.imshow(histImgR[:, :, ::-1]);
    plt.title('histImgR')

    plt.tight_layout()
    plt.show()


def grayEqualize(img):
    img = cv2.cvtColor(img, cv2.COLOR_BGR2GRAY)
    equ = cv2.equalizeHist(img)
    # 两个图片的像素分布连接在一起,拍成一维数组
    res = np.hstack((img, equ))

    plt.figure(figsize=(8, 6))
    ax1 = plt.subplot2grid((2, 2), (0, 0))
    ax1.imshow(img, cmap=plt.cm.gray)
    ax1.set_title('orignal image')

    ax1 = plt.subplot2grid((2, 2), (0, 1))
    ax1.imshow(equ, cmap=plt.cm.gray)
    ax1.set_title('equalization')

    ax1 = plt.subplot2grid((2, 2), (1, 0), colspan=3, rowspan=1)
    ax1.imshow(res, cmap=plt.cm.gray)
    ax1.set_title('horizational')

    plt.tight_layout()
    plt.show()


def colorEqualize(img):
    def hisEqulColor(img):
        ycrcb = cv2.cvtColor(img, cv2.COLOR_BGR2YCR_CB)
        channels = cv2.split(ycrcb)
        print(len(channels))
        cv2.equalizeHist(channels[0], channels[0])
        cv2.merge(channels, ycrcb)
        cv2.cvtColor(ycrcb, cv2.COLOR_YCR_CB2BGR, img)
        return img

    equ = hisEqulColor(img)

    h_stack_img = np.hstack((img, equ))

    plt.figure(figsize=(10, 8))
    ax1 = plt.subplot2grid((2, 2), (0, 0))
    ax1.imshow(img[:, :, ::-1])
    ax1.set_title('orignal image')

    ax1 = plt.subplot2grid((2, 2), (0, 1))
    ax1.imshow(equ[:, :, ::-1])
    ax1.set_title('equalization')

    ax1 = plt.subplot2grid((2, 2), (1, 0), colspan=3, rowspan=1)
    ax1.imshow(h_stack_img[:, :, ::-1])
    ax1.set_title('horizational')

    plt.tight_layout()
    plt.show()


plt.figure()
plt.title("Grayscale Histogram")
plt.xlabel("Bins")
plt.ylabel("# of Pixels")
# 灰度直方图
img = cv2.imread('lena.jpg')
GrayHist(img)
# 颜色直方图
colorHist(img)
# 多通道直方图
channelsHist(img)
# 灰度直方图均衡
grayEqualize(img)
# 彩色图像直方图均衡
colorEqualize(img)
灰度直方图

颜色直方图

多通道直方图

灰度直方图均衡

彩色图像直方图均衡

本博客所有文章除特别声明外,均采用 CC BY-SA 3.0协议 。转载请注明出处!